

Read the Overview dashboard
Summary
Section titled “Summary”Overview is the first item in the left sidebar of the KonversAI console, and it is the screen you land on when you open your tenant. The screen carries the heading Insights & Analytics and the line AI performance metrics and optimization opportunities. The screen holds one written summary and five metric widgets: Automation trend, Automation Rate, Transfer Rate, Customer Satisfaction and Per-topic confidence.
Who can do this
Section titled “Who can do this”Any team member whose role includes analytics access in the KonversAI console. A tenant administrator always has this access. If you cannot see Overview in the left sidebar, you do not have analytics access. Ask an administrator to change your role.
Before you start
Section titled “Before you start”Sign in to the KonversAI console and select your tenant. Overview is the first item in the left sidebar of the console.
Your tenant needs conversations before the numbers mean anything. KonversAI computes each metric from the conversations that started inside the selected time window. A new tenant with no conversations sees a dash (-) instead of a percentage, and -/5 instead of a satisfaction score.
The written summary at the left of the screen refreshes at most once per day. KonversAI builds the summary from the last 7 days when you open the screen, so the first load of a new day can take a minute.
-
Select Overview in the left sidebar of the KonversAI console. The screen opens with the heading Insights & Analytics.
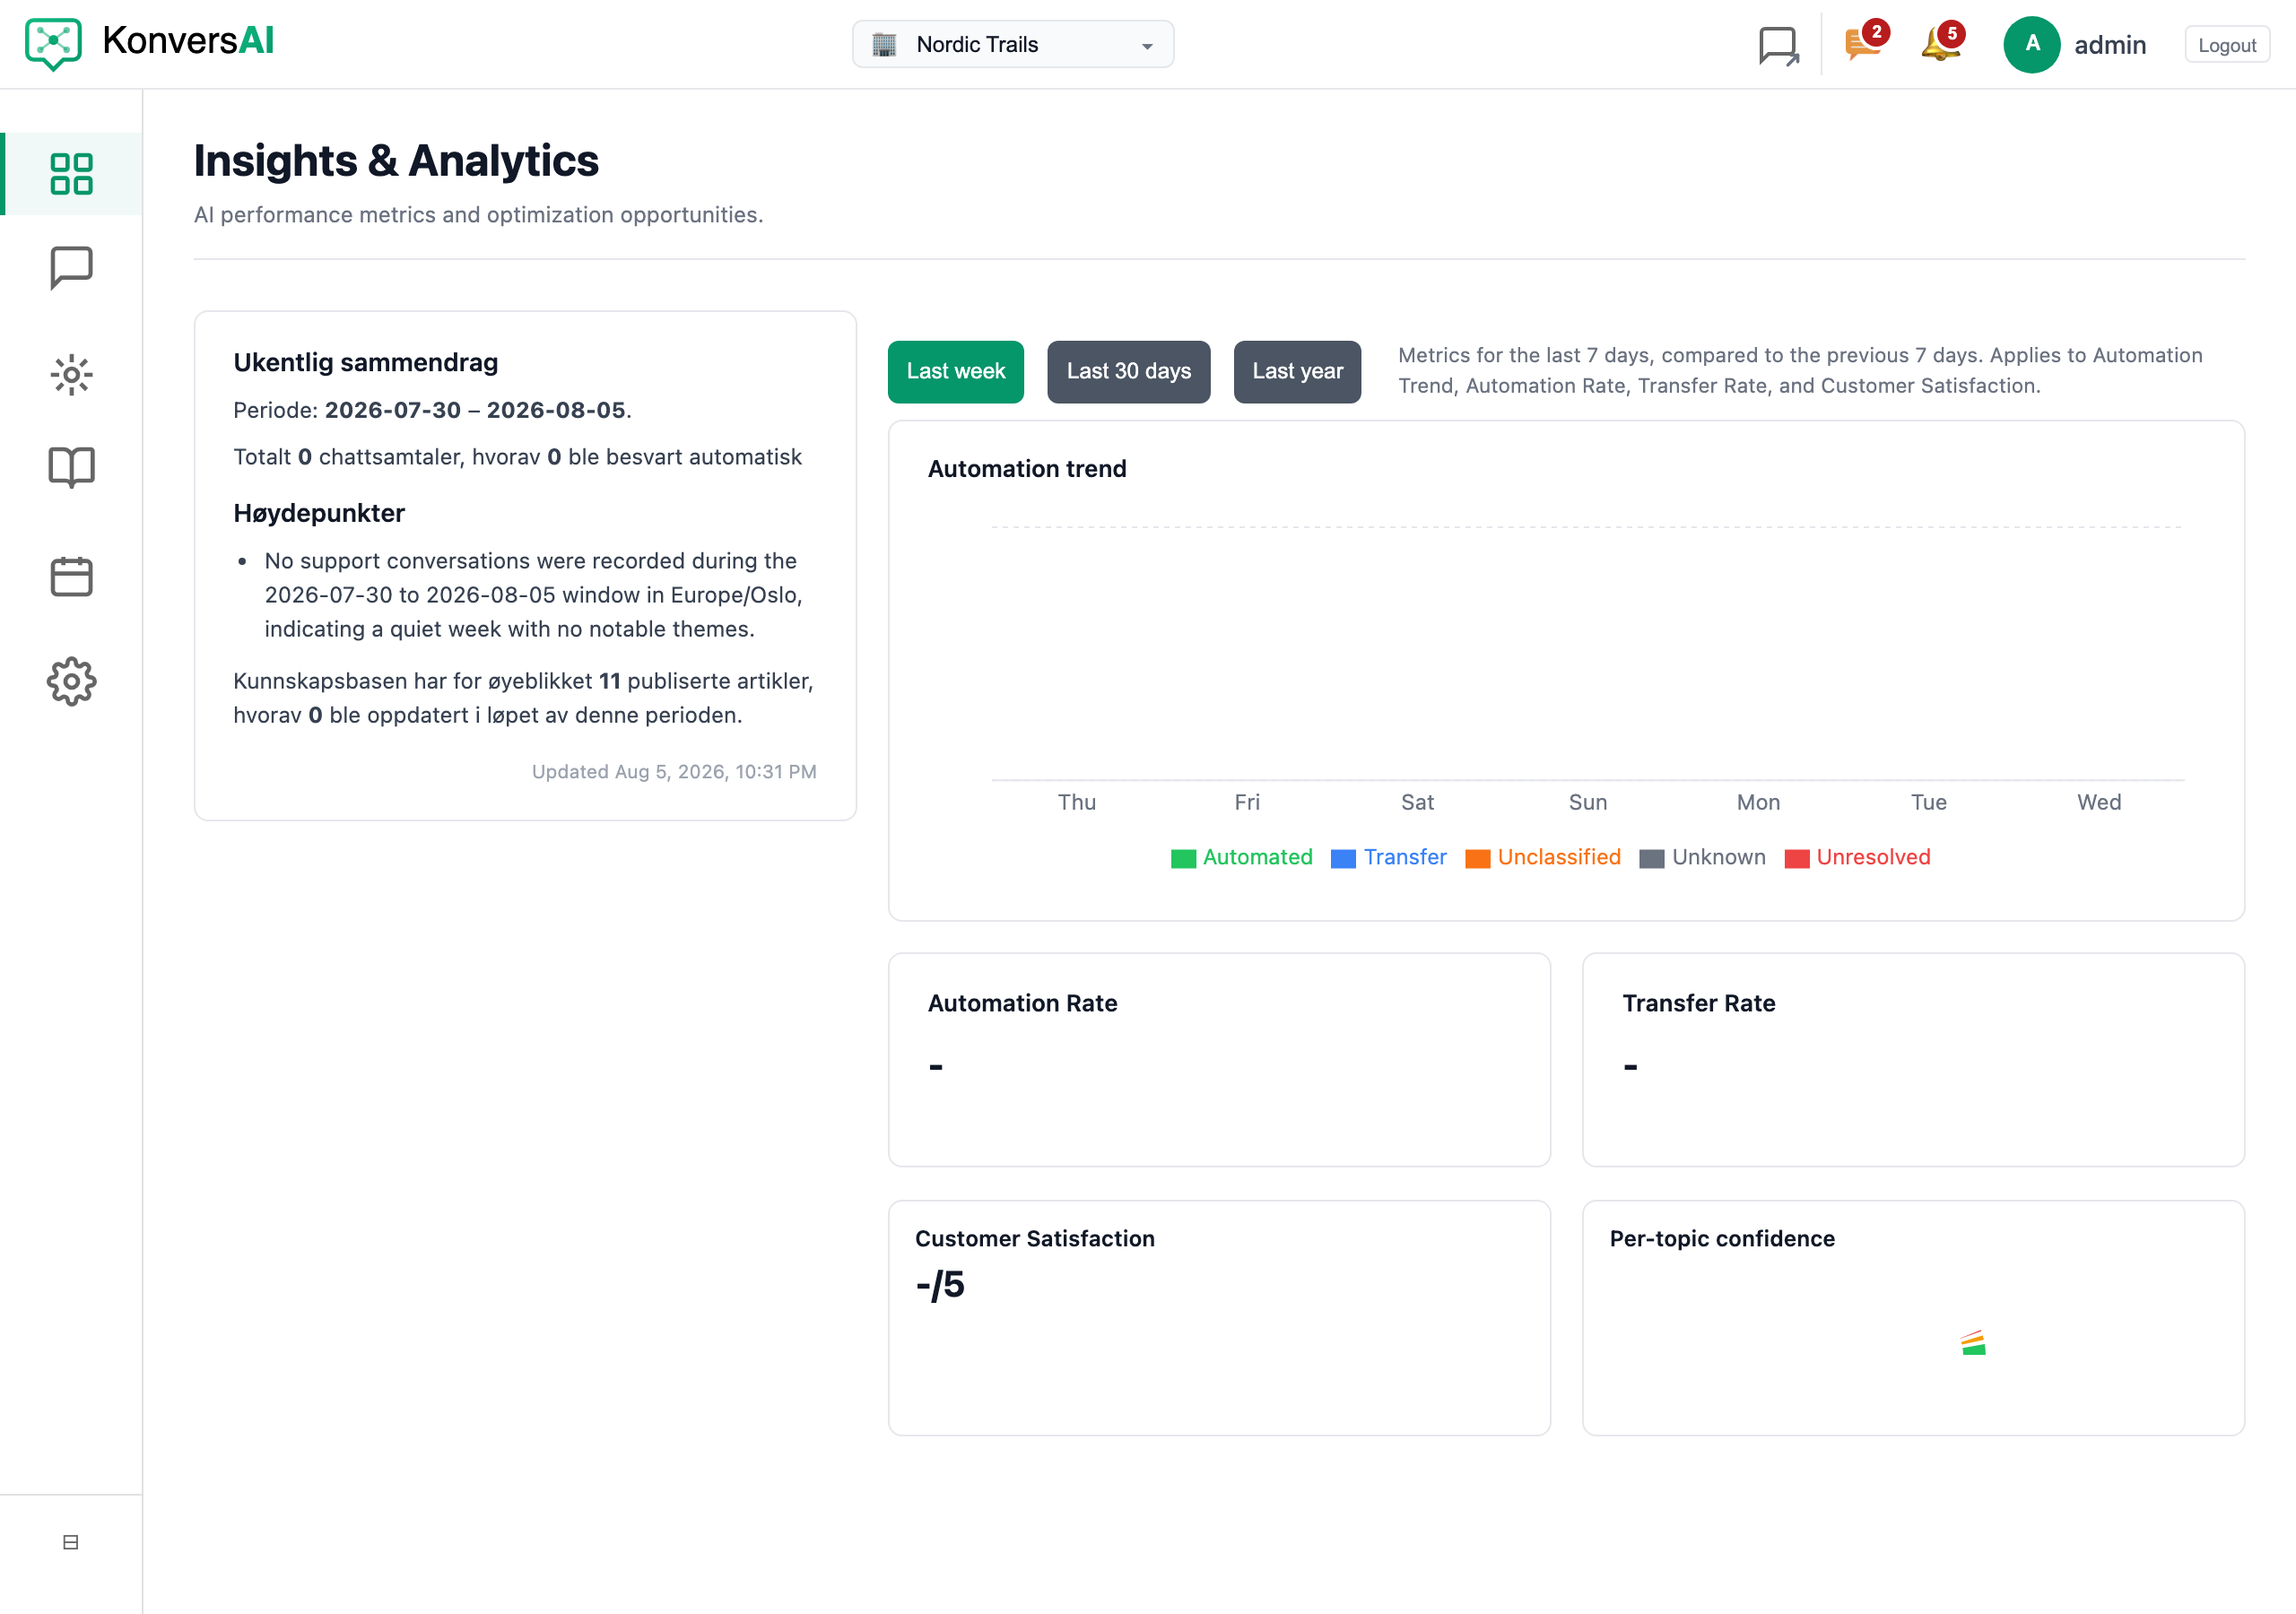
The Overview screen. The time window buttons at the top of the right column change four of the widgets.
-
Read the written summary in the left column. The summary starts with the heading Weekly summary and covers the last 7 days. The summary gives the period dates, the total number of chat conversations, how many the assistant answered automatically, a Highlights list, and a sentence about your published knowledge base articles.
-
Select a link in the Highlights list to open that conversation in the console. Each highlight bullet links to the conversation it describes.
-
Choose the time window for the metric widgets. Select Last week, Last 30 days or Last year at the top of the right column. The default is Last week. The helper text under the buttons names the widgets the choice changes: Applies to Automation Trend, Automation Rate, Transfer Rate, and Customer Satisfaction. The choice does not change the Weekly summary or Per-topic confidence.
-
Read Automation trend. This widget is a stacked bar chart of conversation counts. The six series are Automated, Human, Transfer, Unresolved, Unclassified and Unknown. Human counts conversations a colleague answered rather than the assistant. The chart shows one bar per day for Last week and Last 30 days, and one bar per week for Last year.
-
Select a bar segment in Automation trend to open Chat under Conversations, filtered to that date range and that outcome.
-
Read Automation Rate. This widget shows the percentage of conversations that the assistant closed on its own, with a trend line such as +2.4% from last week. The widget counts every conversation that started in the window, open and closed.
-
Read Transfer Rate. This widget shows the percentage of conversations that went to a person. Automation Rate, Transfer Rate and the human and unresolved shares add up to 100%.
-
Read Customer Satisfaction. This widget shows the average customer rating as a score out of 5, with a star row. The widget shows -/5 when no customer rated a conversation in the window.
-
Read Per-topic confidence. This widget is a doughnut chart with the slices Good, Fair and Bad. The slices count your knowledge topics, not conversations. Select any slice to open the knowledge scorecard.
Why does the sidebar say Overview but the page says Insights & Analytics?
Section titled “Why does the sidebar say Overview but the page says Insights & Analytics?”Both names point at the same screen in the KonversAI console. Overview is the label in the left sidebar. Insights & Analytics is the heading printed on the screen itself, above the line AI performance metrics and optimization opportunities. Use Overview when you tell a colleague where to click.
What is the difference between Automation Rate and Transfer Rate?
Section titled “What is the difference between Automation Rate and Transfer Rate?”Both are percentages on the Overview screen of the KonversAI console, and both use the time window you pick with Last week, Last 30 days or Last year. Automation Rate counts the conversations the assistant finished without a person. Transfer Rate counts the conversations that went to a person. The remainder is answered by a colleague or unresolved. The shares add up to 100%. The denominator is every conversation that started in the window, open and closed.
My numbers show a dash instead of a percentage. What does that mean?
Section titled “My numbers show a dash instead of a percentage. What does that mean?”A dash (-) on the Overview screen of the KonversAI console means no data in the selected window, not zero percent. No conversation started in that window, so KonversAI has nothing to divide. Customer Satisfaction shows -/5 for the same reason: no customer rated a conversation. Select a longer window, such as Last 30 days or Last year, to see the numbers.
The Weekly summary says “Generating summary…”. How long does it take?
Section titled “The Weekly summary says “Generating summary…”. How long does it take?”Generating summary… on the Overview screen of the KonversAI console means KonversAI is writing the summary right now. The screen updates by itself when the summary is ready, usually inside a minute or two. KonversAI builds this summary from the last 7 days and keeps it for the rest of the day, so you see it at once on your next visit. No summary available yet. means KonversAI has not built a summary for your tenant yet.
Why does the Per-topic confidence chart not change when I switch to Last year?
Section titled “Why does the Per-topic confidence chart not change when I switch to Last year?”Per-topic confidence on the Overview screen of the KonversAI console does not follow the time window buttons. The chart shows the current state of your knowledge topics, with the slices Good, Fair and Bad. Topics that still collect data do not appear. The helper text under Last week, Last 30 days and Last year names only the four widgets those buttons change: Automation Trend, Automation Rate, Transfer Rate and Customer Satisfaction.
Where do I find knowledge health, knowledge gaps or topic details?
Section titled “Where do I find knowledge health, knowledge gaps or topic details?”Not on Overview. In the left sidebar of the KonversAI console, select Knowledge, then Dashboard for the Knowledge health summary, Total documents and Freshness of URL documents. Select Knowledge and then Topics for your topic list. The only knowledge signal on the Overview screen is the sentence in the Weekly summary about published and updated articles, plus the Per-topic confidence doughnut.
What does the Unclassified series in Automation trend mean?
Section titled “What does the Unclassified series in Automation trend mean?”Unclassified is one of six series in the Automation trend chart on the Overview screen of the KonversAI console. The other five are Automated, Human, Transfer, Unresolved and Unknown. Unclassified counts conversations that KonversAI has not given an outcome yet. Recent and still-open conversations often sit here. A large Unclassified share in an old period is worth a look: select the bar segment to open those conversations in Chat.
A widget shows “Failed to load”. What do I do?
Section titled “A widget shows “Failed to load”. What do I do?”Failed to load on the Overview screen of the KonversAI console means the console could not read that one widget. Reload the page first. The other widgets load on their own, so one failing widget does not mean the screen is broken. If the same widget fails after a reload, check that your role still includes analytics access, then contact KonversAI support with the widget name and the time window you selected.
Last reviewed . Tell us when a step no longer matches the product.