

Read the Knowledge dashboard
Summary
Section titled “Summary”Knowledge dashboard is the health screen for your knowledge base in the KonversAI console. Select Knowledge in the left sidebar, then select Dashboard. The page heading is Knowledge dashboard, above the line Health and freshness overview of your tenant knowledge base. The screen holds three widgets at the top — Knowledge health summary, Freshness of URL documents and Total documents — then a Topics section of score cards, then a Quality indicators section.
Who can do this
Section titled “Who can do this”Any team member whose role has the View analytics permission. A tenant administrator always has this permission. An administrator sets it on Settings > Users & permissions in the KonversAI console. If you cannot see Knowledge > Dashboard in the left sidebar, you do not have the View analytics permission. Ask an administrator to change your role.
Before you start
Section titled “Before you start”You read the Knowledge dashboard in the KonversAI console. Sign in, select your tenant, then select Knowledge > Dashboard in the left sidebar. The screen is not behind a feature flag. Every tenant has it.
Your tenant needs documents before the numbers mean anything. A knowledge base with no documents shows Total documents as 0, and Freshness of URL documents shows 0 in every slice.
The Topics section appears when your tenant has at least one active topic, or customer messages in Uncategorized. One topic is enough, even before you run Apply on the Topics screen. The Quality indicators section appears only after KonversAI runs a quality check on a document.
This screen is not the Overview screen. Overview is the first item in the left sidebar, it carries the heading Insights & Analytics, and it measures conversations: automation rate, transfer rate and customer satisfaction. Knowledge dashboard measures the knowledge base itself: documents, freshness, topics and quality. Read Read the Overview dashboard for the conversation numbers.
-
Select Knowledge in the left sidebar of the KonversAI console, then select Dashboard. The screen opens with the heading Knowledge dashboard.
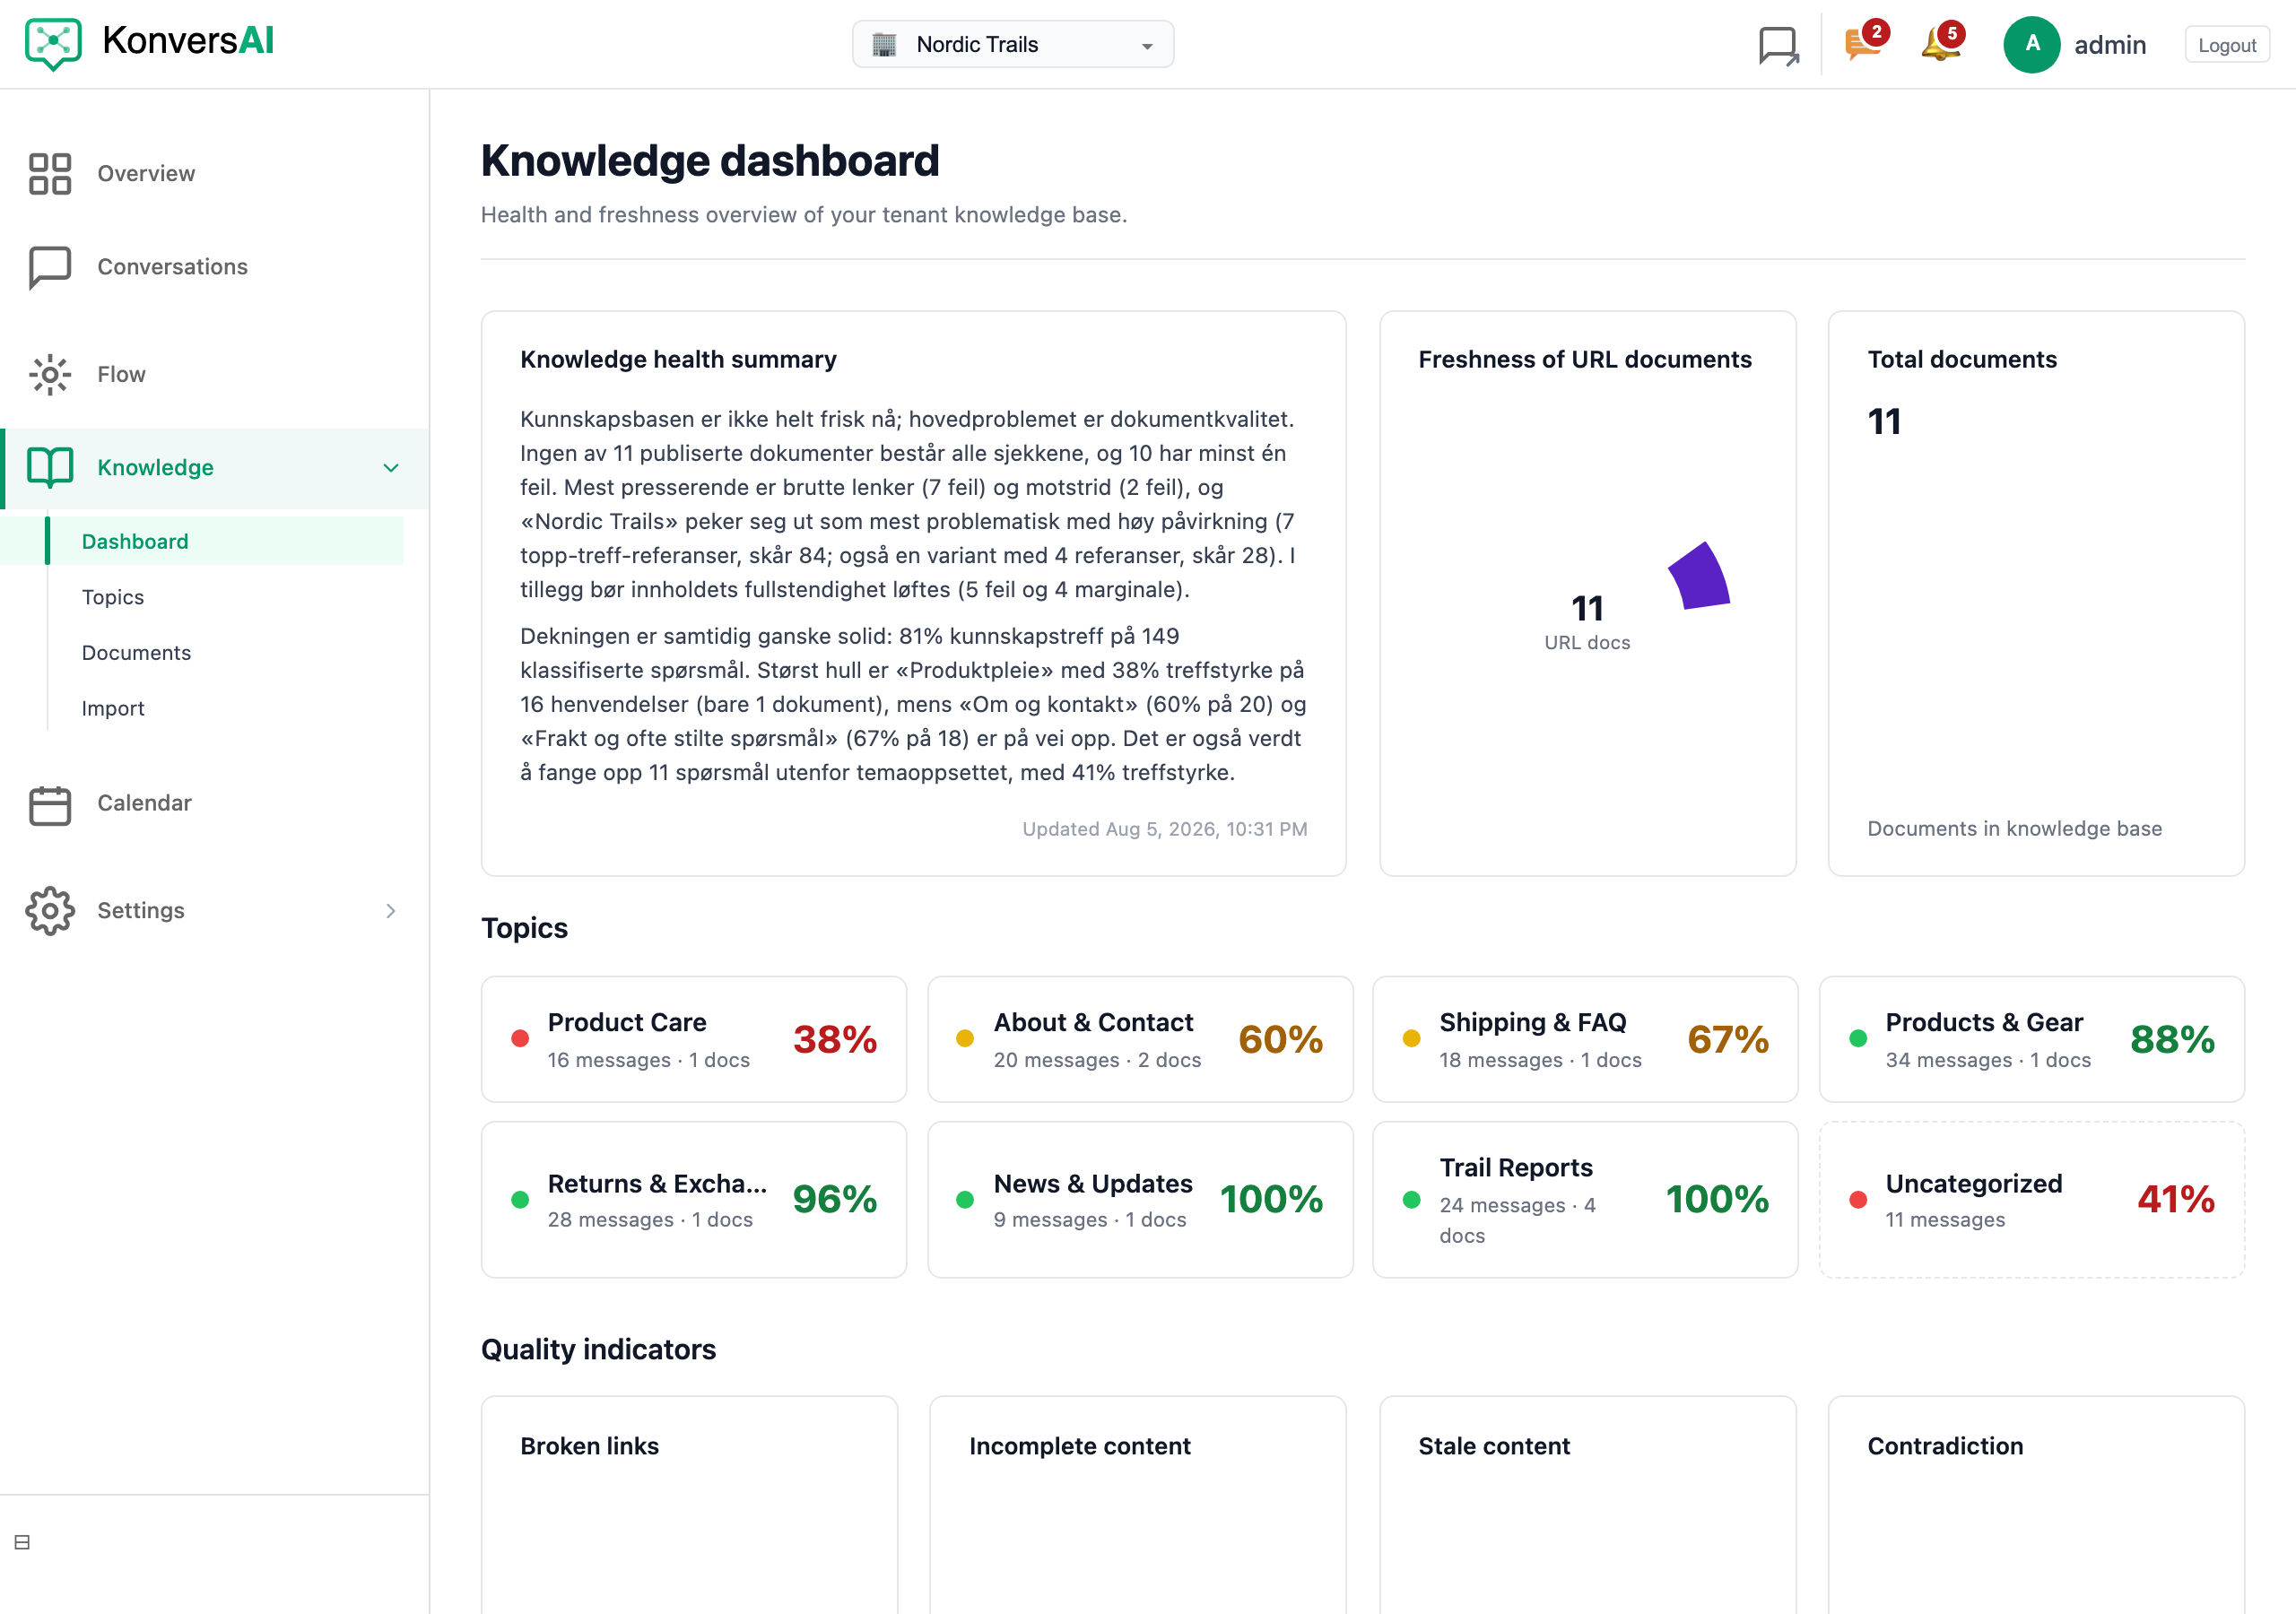
The Knowledge dashboard. It reports the health of the knowledge base, not the conversations.
-
Read Knowledge health summary, the first widget on the screen. KonversAI writes this short assessment for you in your tenant language, from your current document quality and your current topic coverage. KonversAI keeps one summary for each Monday-to-Sunday week, so the text changes at most once per week. The line Updated with a date and time sits below the text.
-
Read Freshness of URL documents, the doughnut beside it. This doughnut counts the pages KonversAI imported from a website, grouped by the time since the last fetch. The five slices are Less than 2h, Less than 24h, Less than 7d, Less than 30d and Older than 30 days. The number in the middle is the total, above the label URL docs. This widget ignores files and text documents.
-
Read Total documents. This number counts every document in the knowledge base, with the line Documents in knowledge base below it. The count includes drafts and archived documents, and it uses no time window.
-
Read the Topics section. Each card shows a topic name, the message count and the document count in the form 12 messages · 4 docs, and a percent. The percent is the knowledge match strength for that topic over the last 30 days. A low percent means your documents did not match the questions well. A dash (—) means the topic has no questions yet.
-
Select a topic card to open that topic page. The topic page shows Knowledge match strength, Amount of messages, Documents assigned, and the charts Knowledge match strength trend and Document quality.
-
Select the Uncategorized card in the Topics section. The Uncategorized page lists customer messages that match none of your topics, over the last 30 days, with Uncategorized messages, Unanswered, Share of total traffic and Goal. Keep this list short.
-
Read the Quality indicators section at the bottom. KonversAI shows one doughnut for each check it ran, named Broken links, Incomplete content, Stale content or Contradiction. Each doughnut has the slices Good, Fair, Bad and Pending, and the number in the middle is the Good count. Pending counts the documents KonversAI has queued for that check but not finished.
-
Select the Bad slice of any quality doughnut. KonversAI opens Knowledge > Documents, filtered to the documents that failed that check. Fix those documents first.
What is the difference between the Knowledge dashboard and the Overview screen?
Section titled “What is the difference between the Knowledge dashboard and the Overview screen?”They measure two different things in the KonversAI console. Overview is the first item in the left sidebar and carries the page heading Insights & Analytics. It measures conversations: Automation trend, Automation Rate, Transfer Rate, Customer Satisfaction and Per-topic confidence. Knowledge dashboard sits under Knowledge > Dashboard in the left sidebar and measures the knowledge base: Knowledge health summary, Freshness of URL documents, Total documents, the Topics score cards and the Quality indicators. Use Overview to answer “how is the assistant doing?”. Use Knowledge dashboard to answer “is my content good enough?”.
The Knowledge health summary says “Generating summary…”. How long does it take?
Section titled “The Knowledge health summary says “Generating summary…”. How long does it take?”Generating summary… on Knowledge > Dashboard in the KonversAI console means KonversAI is writing the text right now. The widget updates by itself when the summary is ready, usually inside a minute or two. KonversAI builds one summary for each Monday-to-Sunday week and keeps it, so you see it at once on your next visit. No summary available yet. means your tenant has no document quality data and no topic data to write about; import a document first. When the widget shows Summary generation failed or Failed to load summary, reload the page, and contact KonversAI support if the text stays.
A widget on the Knowledge dashboard shows no numbers. What does that mean?
Section titled “A widget on the Knowledge dashboard shows no numbers. What does that mean?”Two widgets on Knowledge > Dashboard in the KonversAI console can look empty. Freshness of URL documents counts only the pages KonversAI imported from a website. It shows 0 in the middle, above the label URL docs, and 0 in every slice, when your knowledge base has no imported pages. A file upload or a text document does not count there. Import a website under Knowledge > Import to fill this widget. A quality doughnut behaves differently: the Quality indicators section shows a doughnut only for a check that already ran, so a check with no results has no widget on the screen. KonversAI creates the quality indicators when you save a document and starts them at once. A backfill task runs every Monday at 05:00 for the documents that have none.
My Freshness of URL documents chart is mostly “Older than 30 days”. Is that bad?
Section titled “My Freshness of URL documents chart is mostly “Older than 30 days”. Is that bad?”It depends on your website. Older than 30 days on Knowledge > Dashboard in the KonversAI console counts the imported pages that KonversAI last fetched more than 30 days ago. A page that never changes is safe there. A price page or a news page is not: the assistant answers from old content. KonversAI refreshes a sitemap import every 60 minutes and a crawl import every 7 to 10 days by default, so a large stale group usually means the import is not running. Open the import under Knowledge > Import, select View, and select Sync. See Keep a website import up to date.
A topic card shows a low percent. What should I do?
Section titled “A topic card shows a low percent. What should I do?”The percent on a topic card in the Topics section of Knowledge > Dashboard in the KonversAI console is the knowledge match strength over the last 30 days. A low percent means customers asked about that subject and your documents did not match the questions well. Select the card. The topic page shows the trend, the document quality for that topic, and a Sample messages list of the real questions. Read the sample messages, then either fix the documents in that topic or write a new one. Find out why an answer was wrong gives the full workflow.
What are the Good, Fair, Bad and Pending slices in the Quality indicators section?
Section titled “What are the Good, Fair, Bad and Pending slices in the Quality indicators section?”They are the results of one automatic check on your documents, shown on Knowledge > Dashboard in the KonversAI console. KonversAI runs a check on each document and gives it Good, Fair or Bad. A document waits in Pending until the check finishes, so every new document starts there. The widget names tell you the check: Broken links, Incomplete content, Stale content and Contradiction. The number in the middle of each doughnut is the Good count. Select the Bad slice, and KonversAI opens Knowledge > Documents filtered to the failing documents. Fix Bad before Fair.
Why does the Topics section not appear on my Knowledge dashboard?
Section titled “Why does the Topics section not appear on my Knowledge dashboard?”The Topics section on Knowledge > Dashboard in the KonversAI console appears when your tenant has at least one active topic, or customer messages in Uncategorized. An empty topic list is the common cause of a missing section: select Knowledge > Topics in the left sidebar and create a topic. The section then shows a card for that topic, even before you run Apply. The card shows a dash (—) in place of the percent until customers ask about the subject. Read Organize your knowledge with topics.
How often do the numbers on this screen change?
Section titled “How often do the numbers on this screen change?”Each widget on Knowledge > Dashboard in the KonversAI console has its own cadence. Total documents and the Quality indicators doughnuts read the current state, so they change the moment you add or fix a document. Freshness of URL documents changes each time KonversAI fetches an imported page. The Topics score cards come from a run that KonversAI starts every night, over the last 30 days of customer messages. Knowledge health summary is written once for each Monday-to-Sunday week. Reload the page to get the latest values.
A widget shows “Failed to load”. What do I do?
Section titled “A widget shows “Failed to load”. What do I do?”Failed to load on Knowledge > Dashboard in the KonversAI console means the console could not read that one widget. Reload the page first. Each widget loads on its own, so one failing widget does not mean the screen is broken. If the same widget fails after a reload, check that your role still has the View analytics permission on Settings > Users & permissions, then contact KonversAI support with the widget name.
Last reviewed . Tell us when a step no longer matches the product.